📊 Monitoring an IIS-Based Web Farm with Azure Application Insights
In this guide, you'll learn how to:
✅ Set up Application Insights on an IIS-based web farm.
✅ Configure Log Analytics, Data Collection Rules, and Data Collection Endpoints.
✅ Use PowerShell to install the Application Insights agent.
✅ Monitor live metrics, failures, performance, and logs in real-time.
By the end, you'll have a fully monitored IIS-based web farm using Azure! 🎯
🏗️ Step 1: Enabling Application Insights on IIS Servers
To effectively monitor your IIS-based application, you need to configure Azure Application Insights and ensure all required components are installed on your Azure VMs.
🛠️ Prerequisites
Before proceeding, ensure you have:
- An active Azure Subscription with permissions to create and manage resources.
- A Log Analytics Workspace (LAW) to store collected telemetry data.
- Azure Monitor Agent (AMA) installed on your IIS VMs.
- Necessary permissions to create Data Collection Rules (DCRs) and Data Collection Endpoints (DCEs).
Create a Log Analytics Workspace
- Go to Azure Portal → Search for "Log Analytics Workspaces" → Create.
- Provide the following details:
- Subscription: Select your Azure subscription.
- Resource Group: Choose or create a new one.
- Name: Enter a unique name (e.g.,
log-corpapp-prod-uksouth). - Region: Same as your IIS VMs.
- Click "Review + Create" and deploy the workspace.
🔗 Microsoft Learn: Log Analytics Workspace
Create a Data Collection Endpoint (DCE)
- Navigate to Monitor → Data Collection Endpoints.
- Click "+ Create" and provide:
- Name: e.g.,
dce-corpapp-prod-uksouth. - Subscription & Resource Group: Same as your IIS VMs.
- Region: Same as Log Analytics Workspace.
- Review & create the endpoint.
🔗 Microsoft Learn: Data Collection Endpoints
Create a Data Collection Rule (DCR)
- Go to Monitor → Data Collection Rules → + Create.
- Configure:
- Name:
dcr-corpapp-iis-prod-uksouth - Subscription & Resource Group: Same as above.
- Region: Same as DCE & LAW.
- Define data sources:
- Windows Event Logs: Add
System,Application, etc. - Log Levels: Select relevant levels (Error, Warning, Information).
- Set Destination:
- Choose "Log Analytics Workspace" → Select the previously created workspace.
- Associate with IIS VMs (
WEB01-WEB05). - Review & Create the rule.
🔗 Microsoft Learn: Data Collection Rules
Install the Azure Monitor Agent (AMA)
- Navigate to each IIS VM.
- Under "Monitoring", select "Extensions".
- Click "+ Add" → AzureMonitorWindowsAgent → Install.
- Repeat for all IIS VMs.
🔗 Microsoft Learn: Azure Monitor Agent
Enable Application Insights
- Navigate to Azure Portal → Search for "Application Insights".
- Click "+ Create" → Provide:
- Subscription & Resource Group: Same as VMs.
- Name:
insights-corpapp-prod-uksouth-001. - Region: Same as your IIS VMs.
- Application Type: ASP.NET Web Application.
- Click "Review + Create" and deploy.
🔗 Microsoft Learn: Enable Application Insights
Install the Application Insights Agent
Use the following PowerShell script to install the agent on all of the IIS servers:
# Install the Application Insights Agent
$instrumentationKey = "YOUR-INSTRUMENTATION-KEY"
Install-PackageProvider -Name NuGet -Force
Install-Module -Name ApplicationInsightsWebTracking -Force
Enable-ApplicationInsightsMonitoring -InstrumentationKey $instrumentationKey
Restart-Service W3SVC
📊 Step 2: Using Application Insights for Monitoring
With everything set up, it's time to monitor and analyze application performance! 🔍
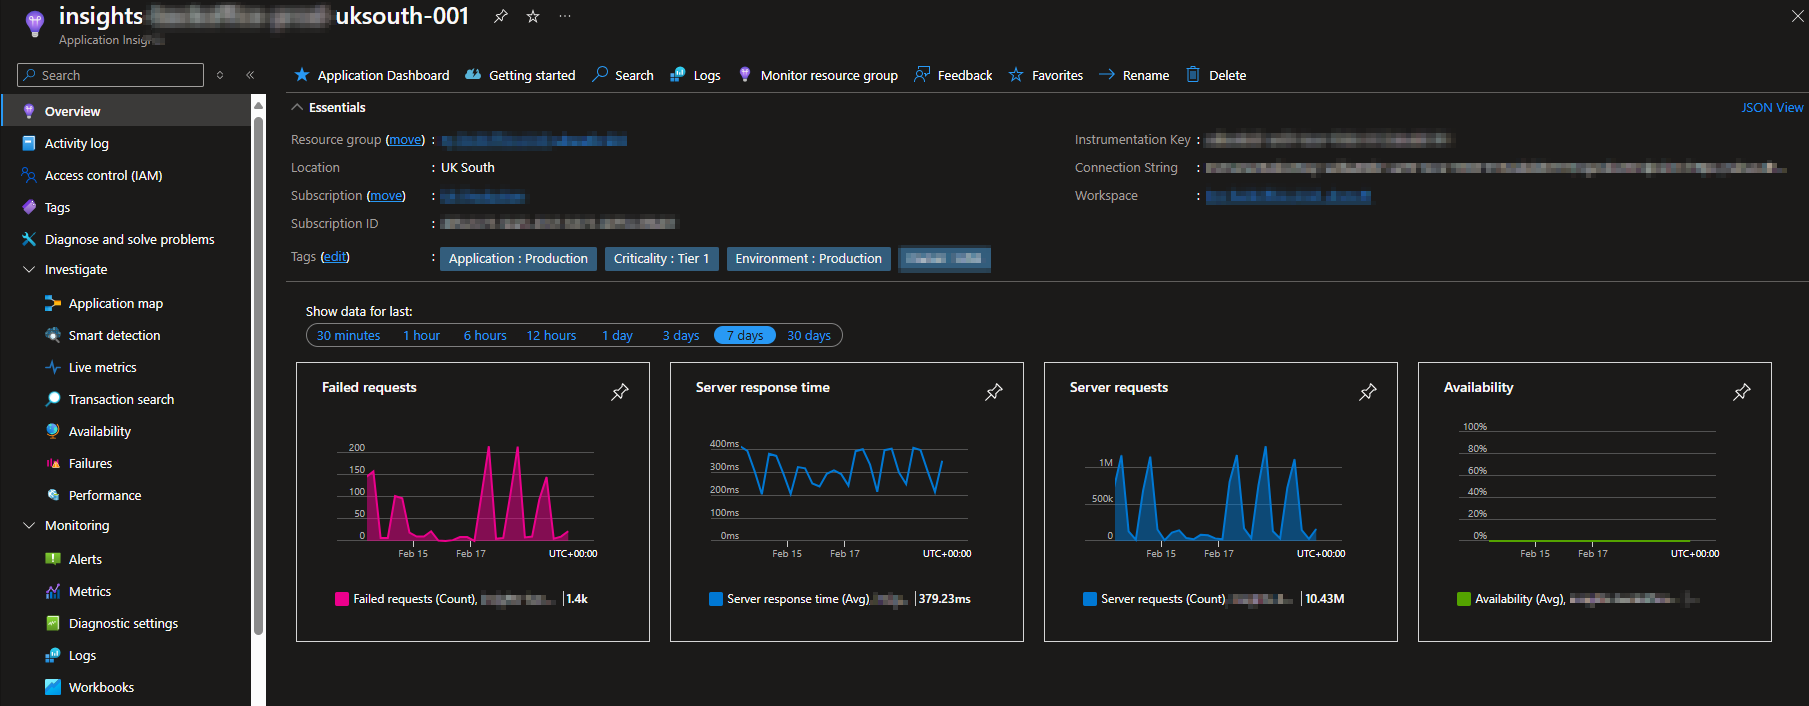
📌 Overview Dashboard
- Displays high-level health metrics, failed requests, and response times.
📸
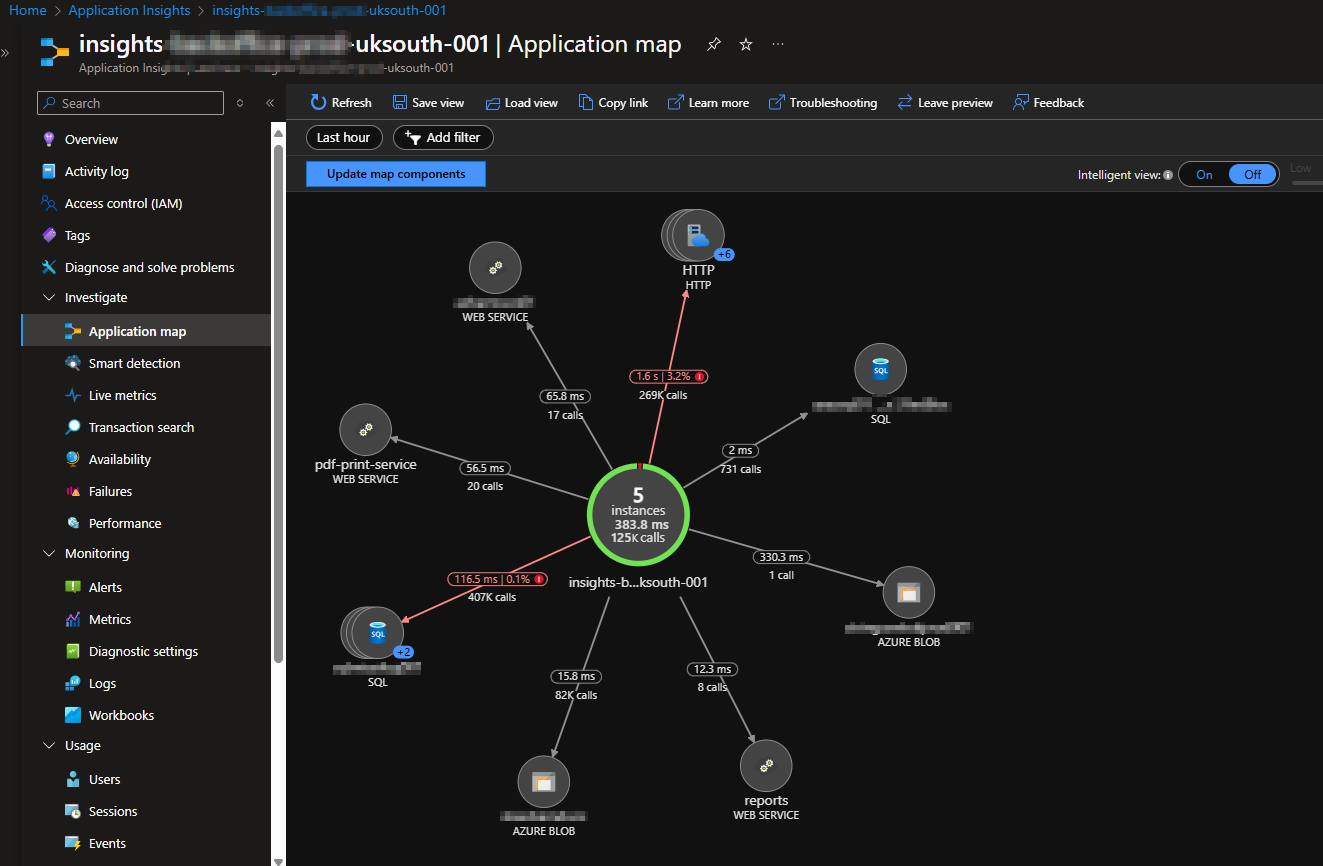
📌 Application Map
- Shows dependencies and interactions between components.
📸
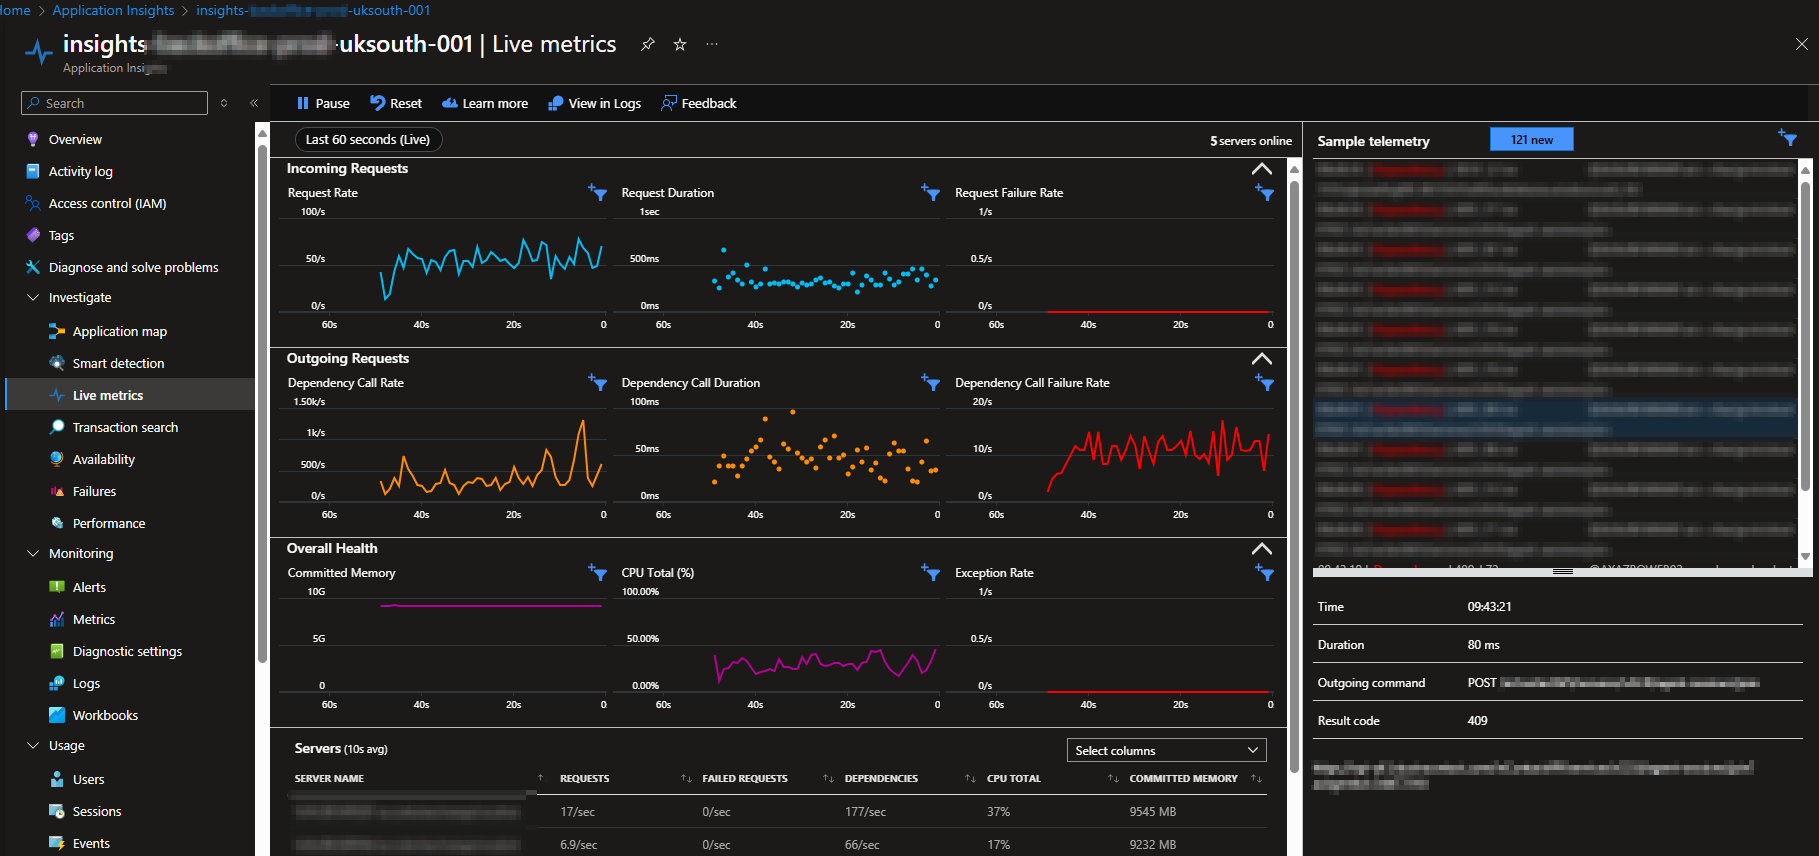
📌 Live Metrics
- Monitor real-time requests, server performance, and failures.
📸
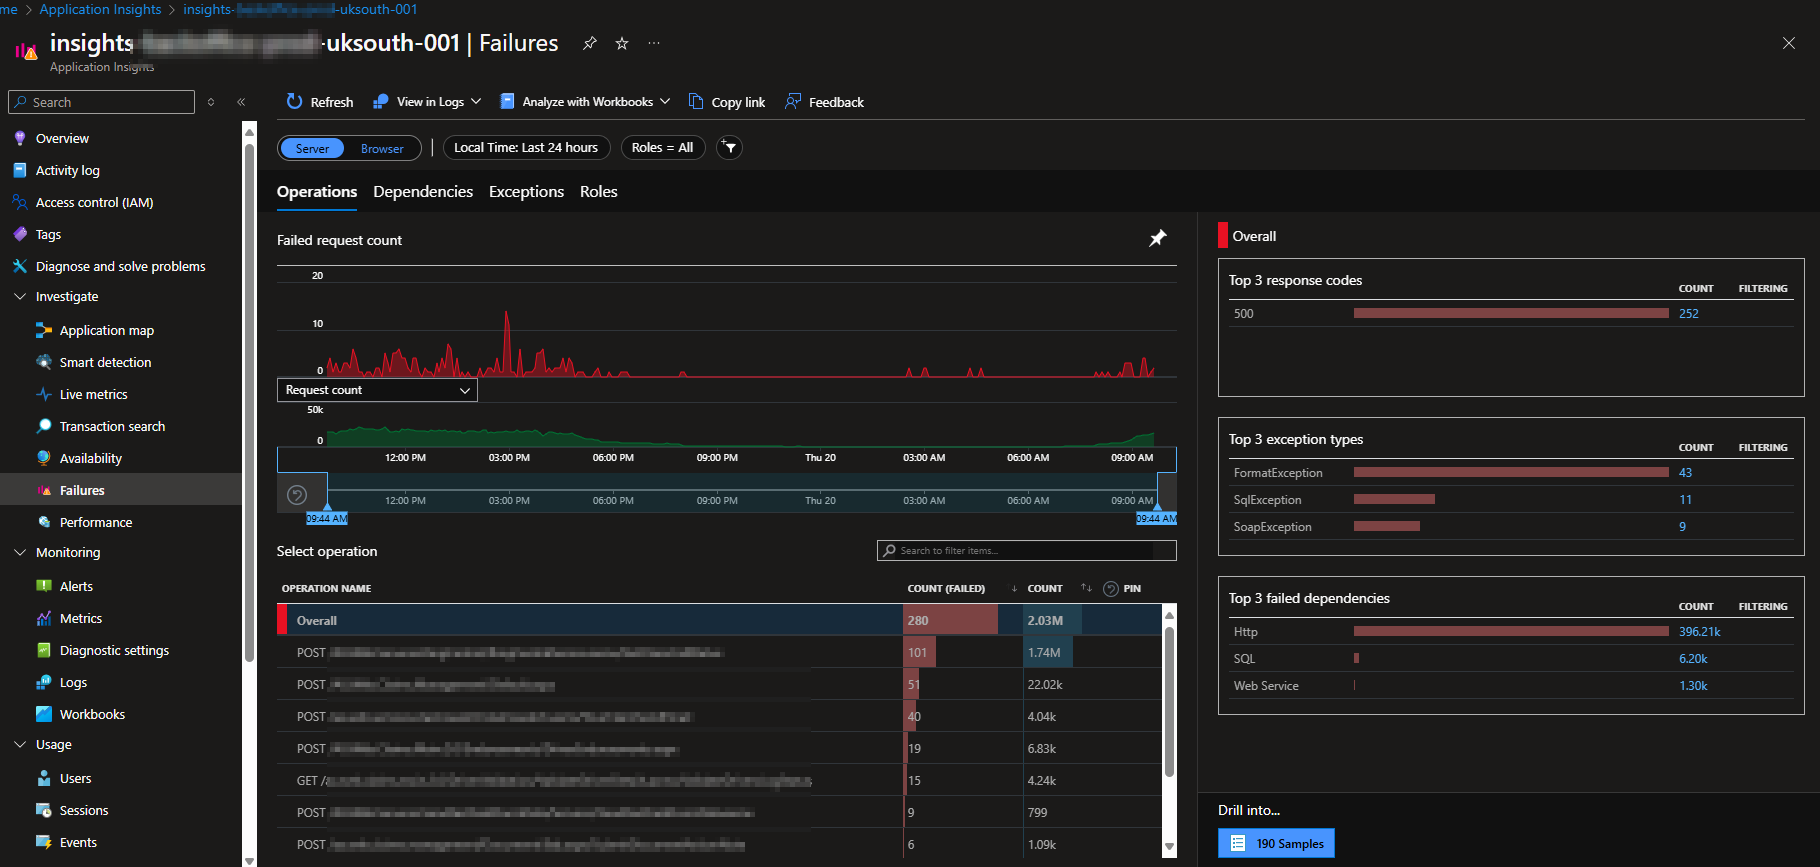
📌 Failures & Exceptions
- Identify and diagnose failed requests & top exceptions.
📸
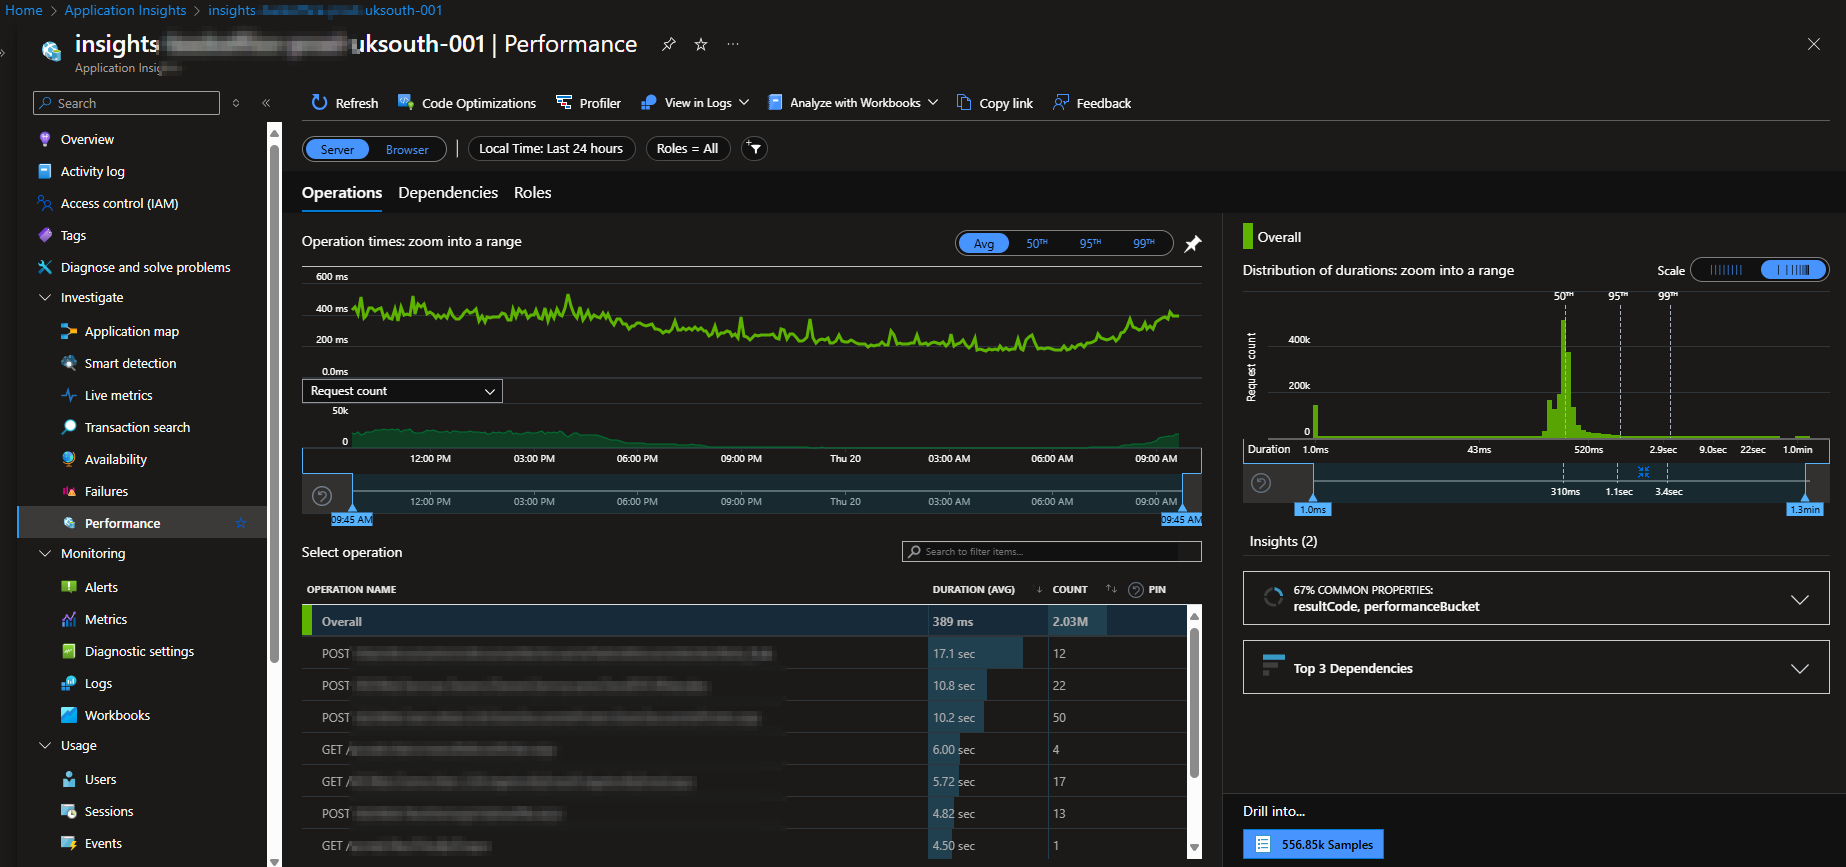
📌 Performance Monitoring
- Analyze response times, dependencies & bottlenecks.
📸
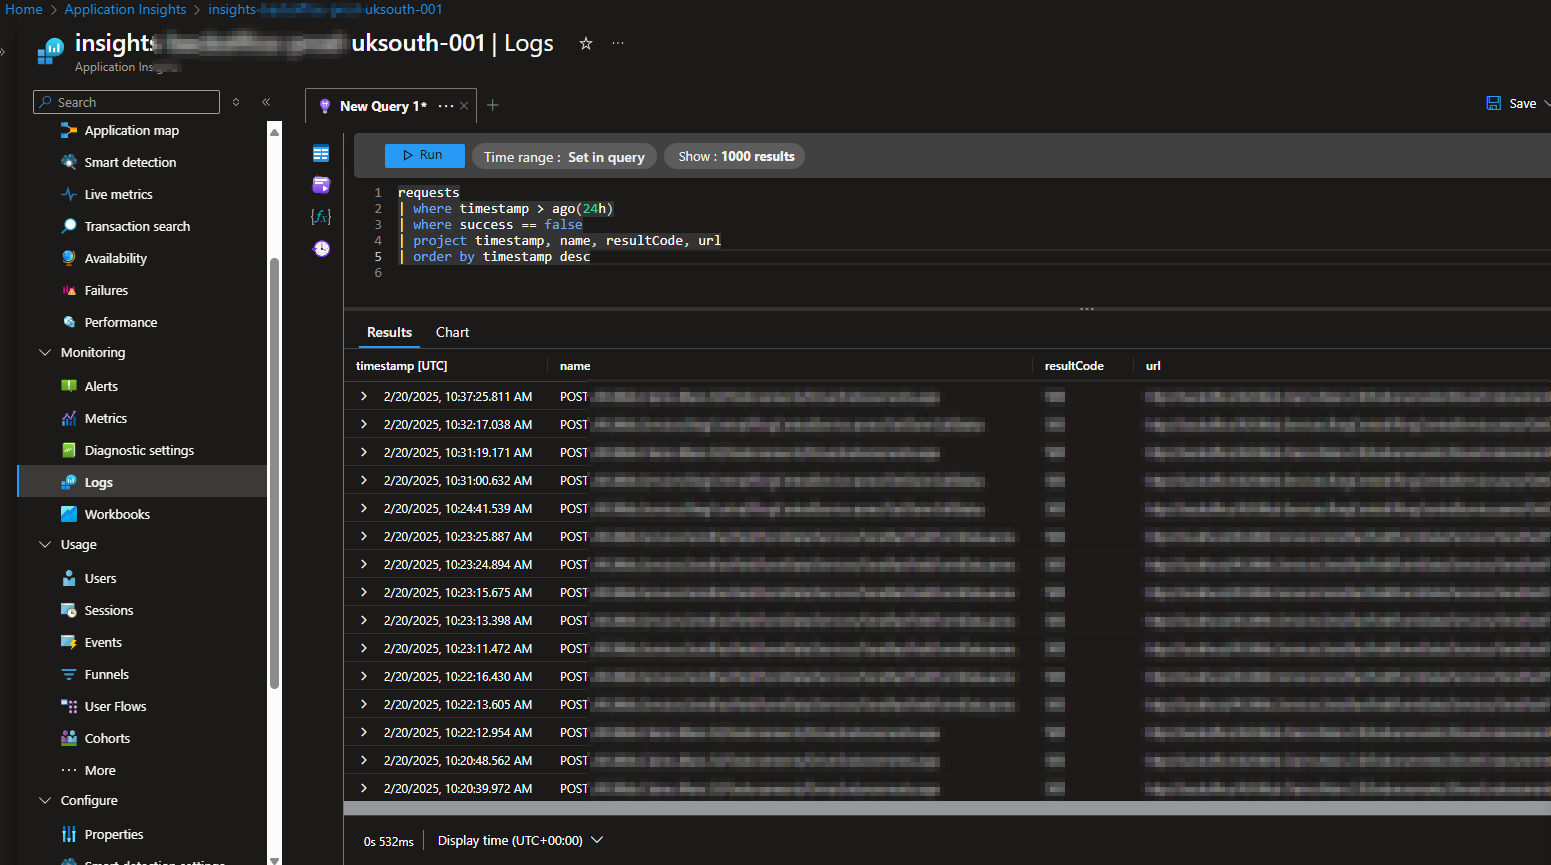
📌 Logs & Queries
- Run Kusto Query Language (KQL) queries for deep insights.
Example query to find failed requests:
requests
| where timestamp > ago(24h)
| where success == false
| project timestamp, name, resultCode, url
| order by timestamp desc
📸 
✅ Next Steps
🎯 Continue monitoring logs & alerts for trends.
🎯 Optimize Application Insights sampling to reduce telemetry costs.
🎯 Automate reporting for key performance metrics.
By following this guide, you'll have a robust, real-time monitoring setup for your IIS web farm, ensuring optimal performance and quick issue resolution! 🚀